![DecisionLensLogo-standard.svg]](https://supporthub.decisionlens.com/hubfs/DecisionLensLogo-standard.svg)
Trade off Analysis is a radar chart that operates using the same data set as in Sensitivity Analysis. The Trade Off Analysis chart allows the user to select decision criteria and alternatives to visualize. The data values are a combination of the outputs from Priorities (criteria priorities) and the performance scores from Rating Alternatives.
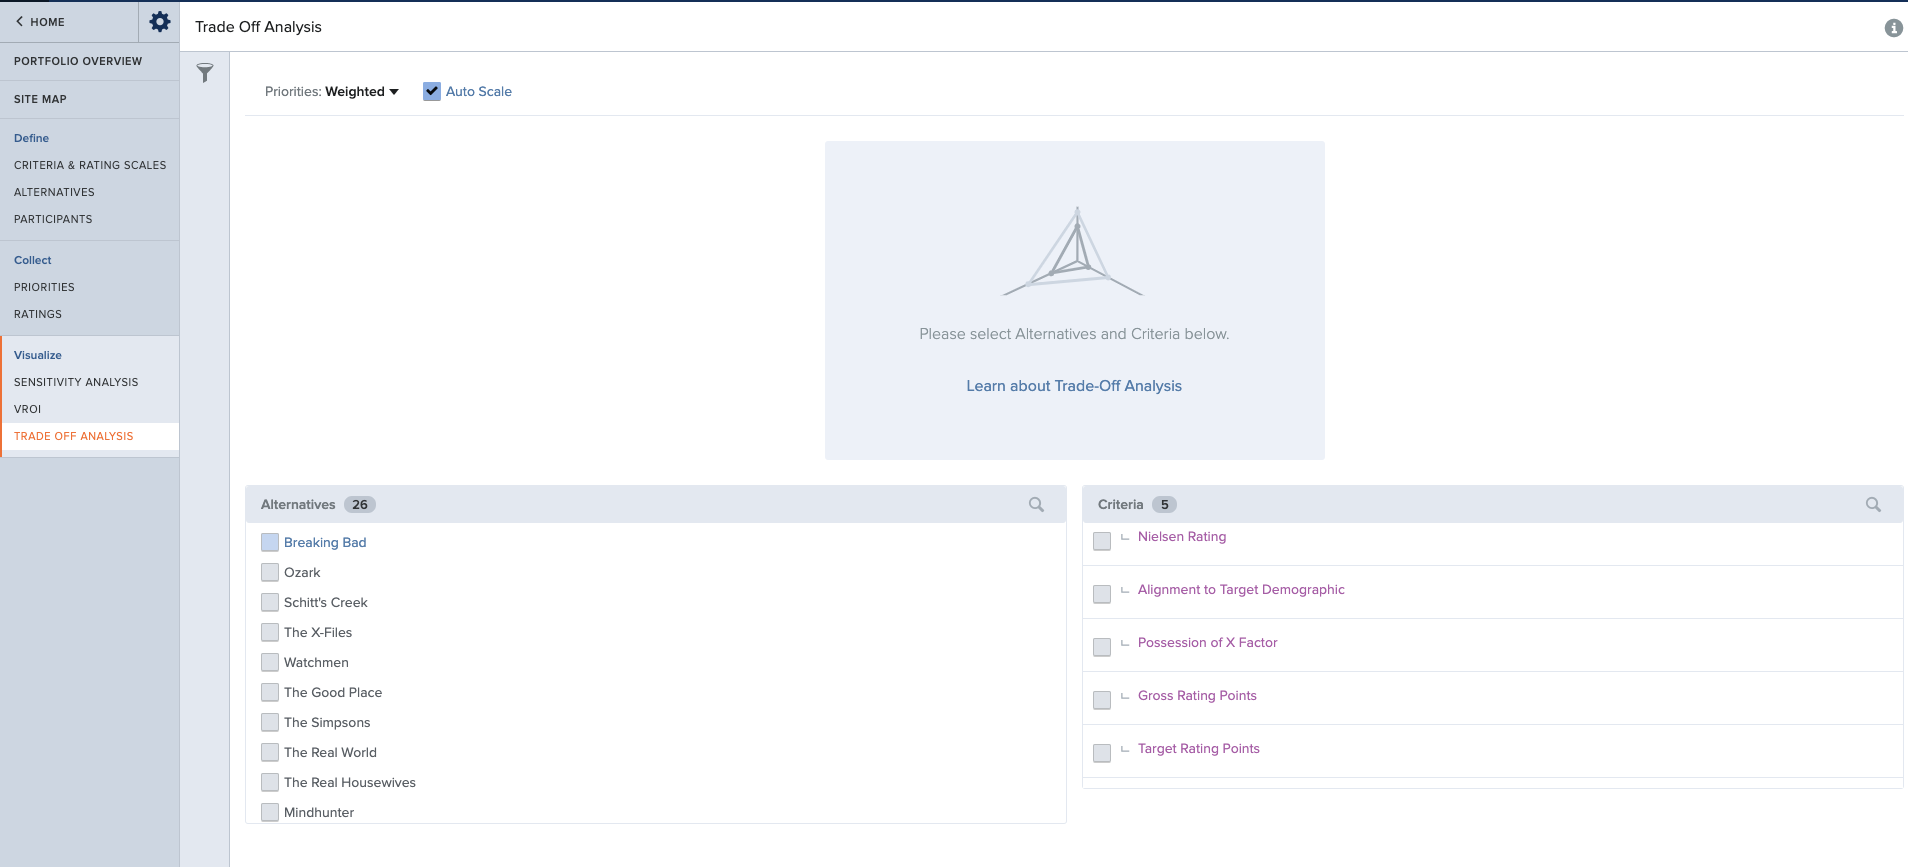
Select display data:
-
Click to select the criteria that you want to display in the chart.
-
Click to select the alternatives that you want to display.
-
The values shown for each alternative are the weighted average of the alternative against the selected criterion.
Chart Interpretation:
Key focal points when looking at Trade Off Analysis are identifying those criteria that clearly differentiate among the alternatives (performance variance) and where the alternative performance scores are very low indicating a deficiency or performance gap.