![DecisionLensLogo-standard.svg]](https://supporthub.decisionlens.com/hubfs/DecisionLensLogo-standard.svg)
Ratings Summary - Graph
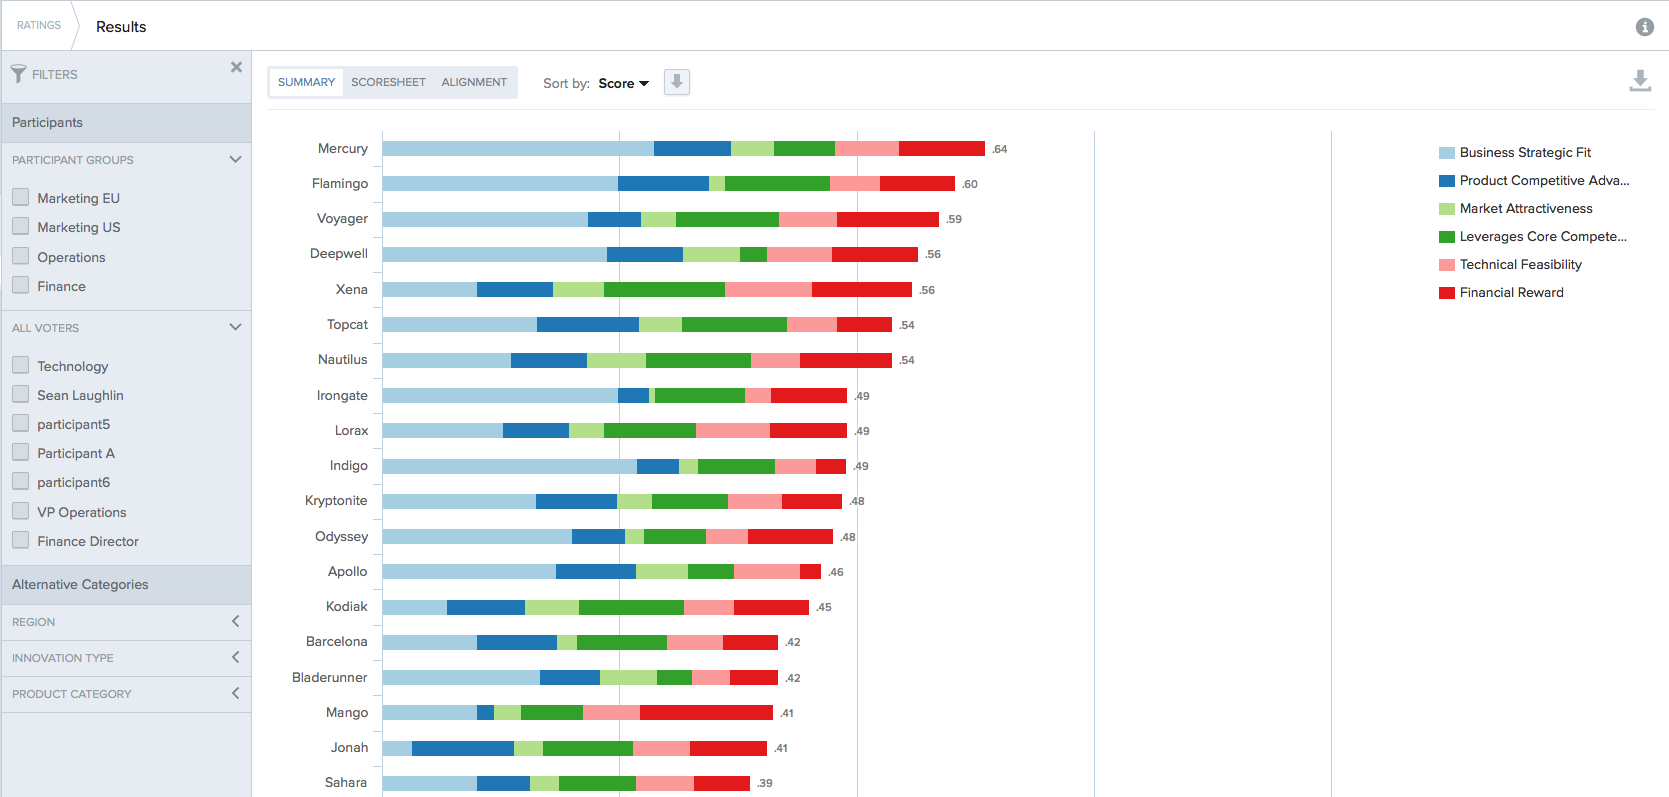
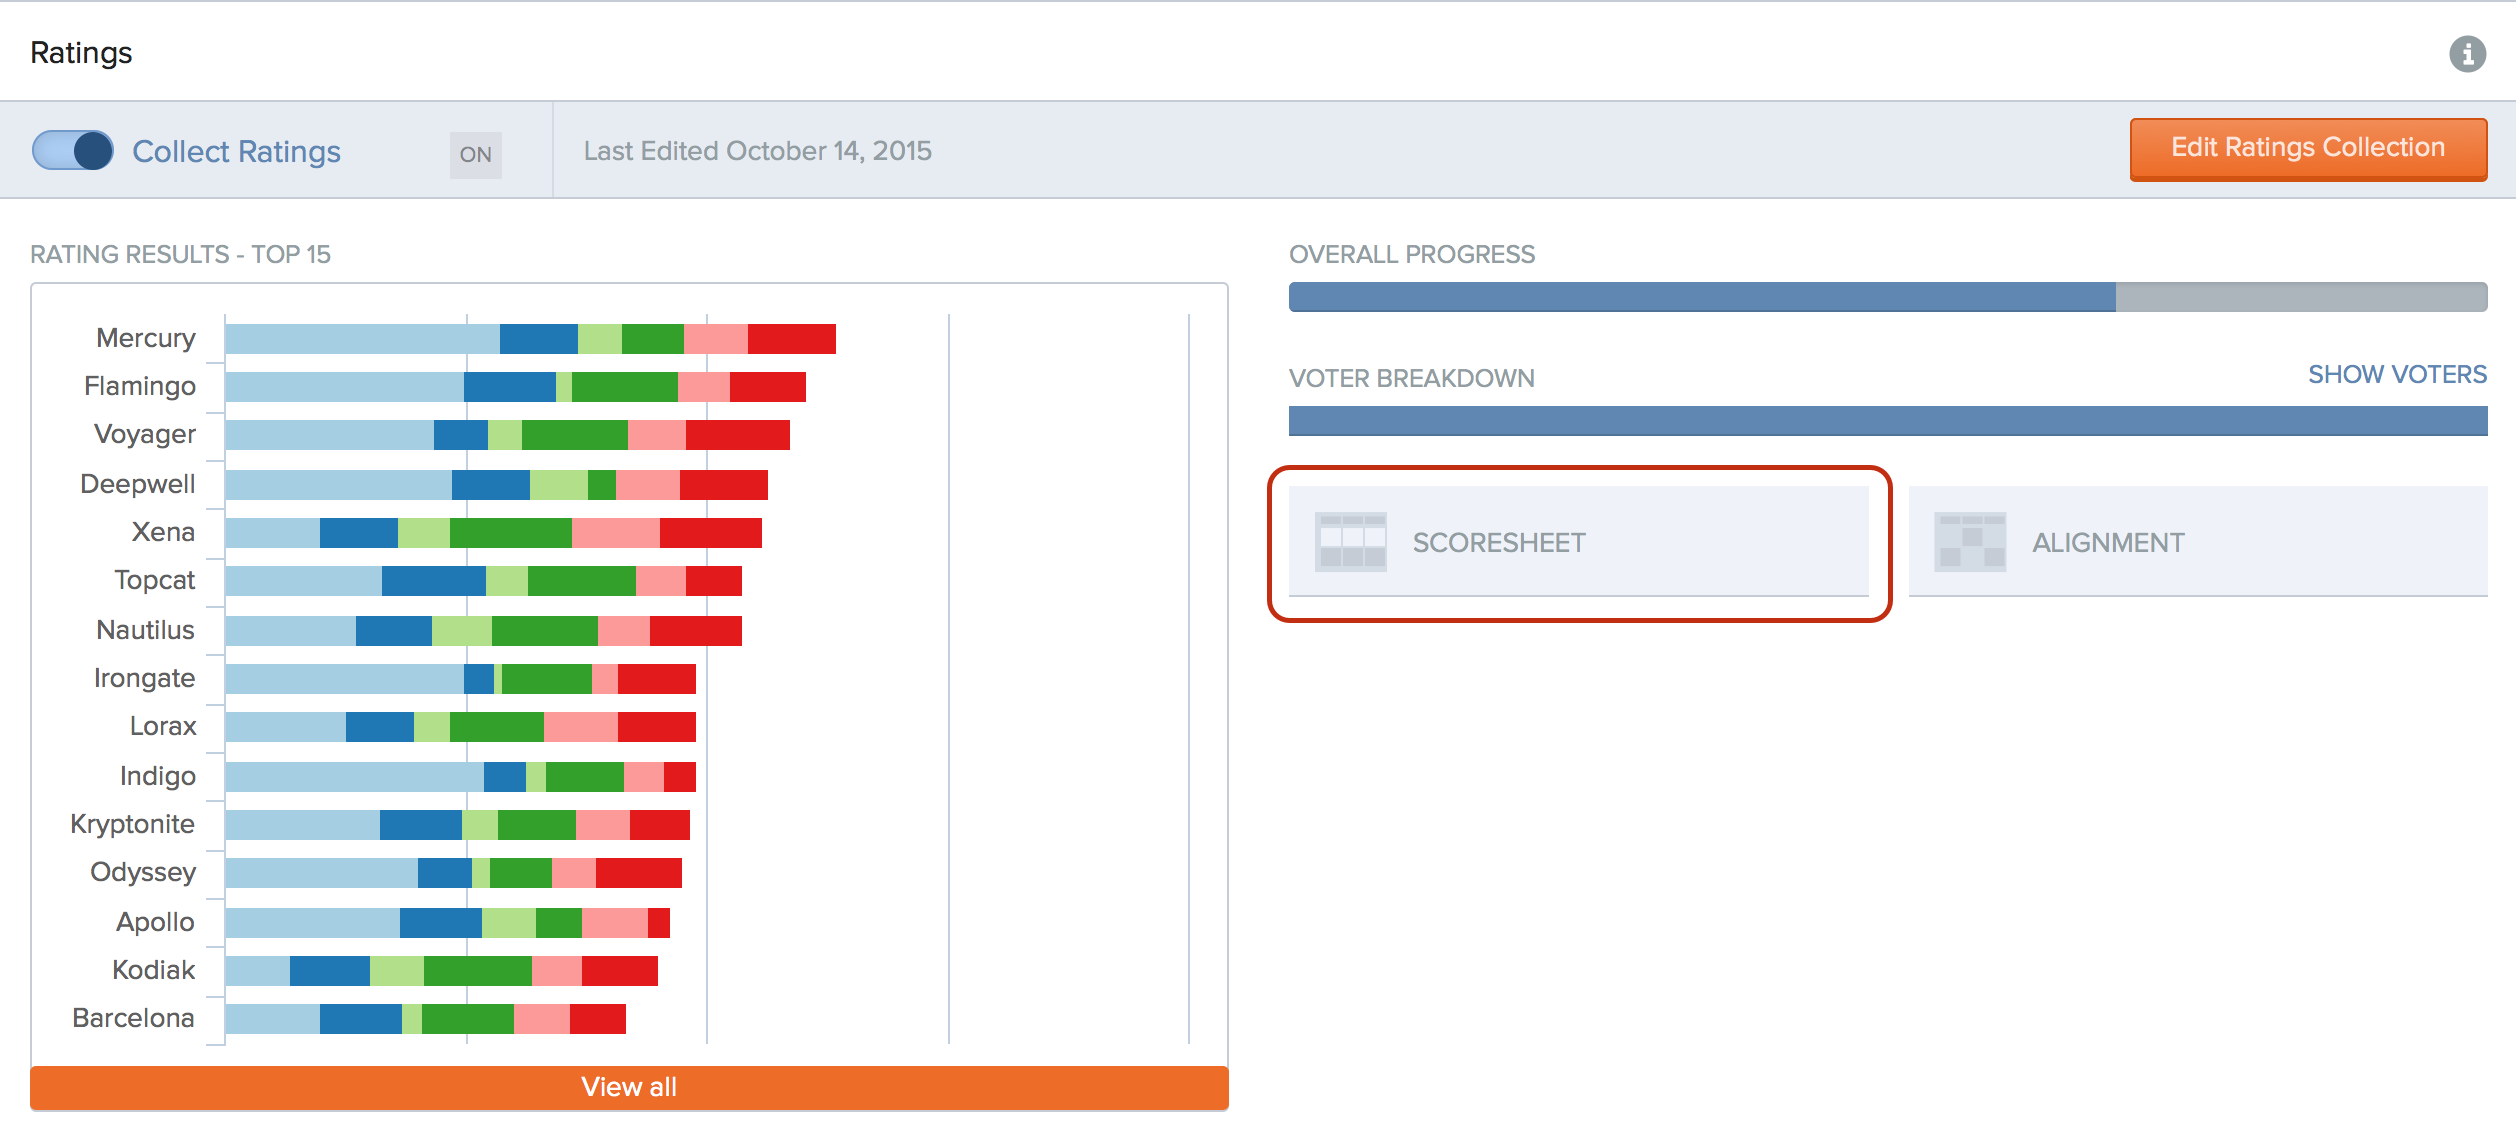
The Ratings Summary graph displays the summary results of the Ratings Collection data. The graph is interactive and users can double click to on a color segment to drill down to lower levels. Click the legend to deselect a criteria and the graph will update automatically as options are selected/deselected. Use the Filter panel to view participant weighting, custom priority sets, participant groups, and filter by alternative categories.
Ratings Scoresheet
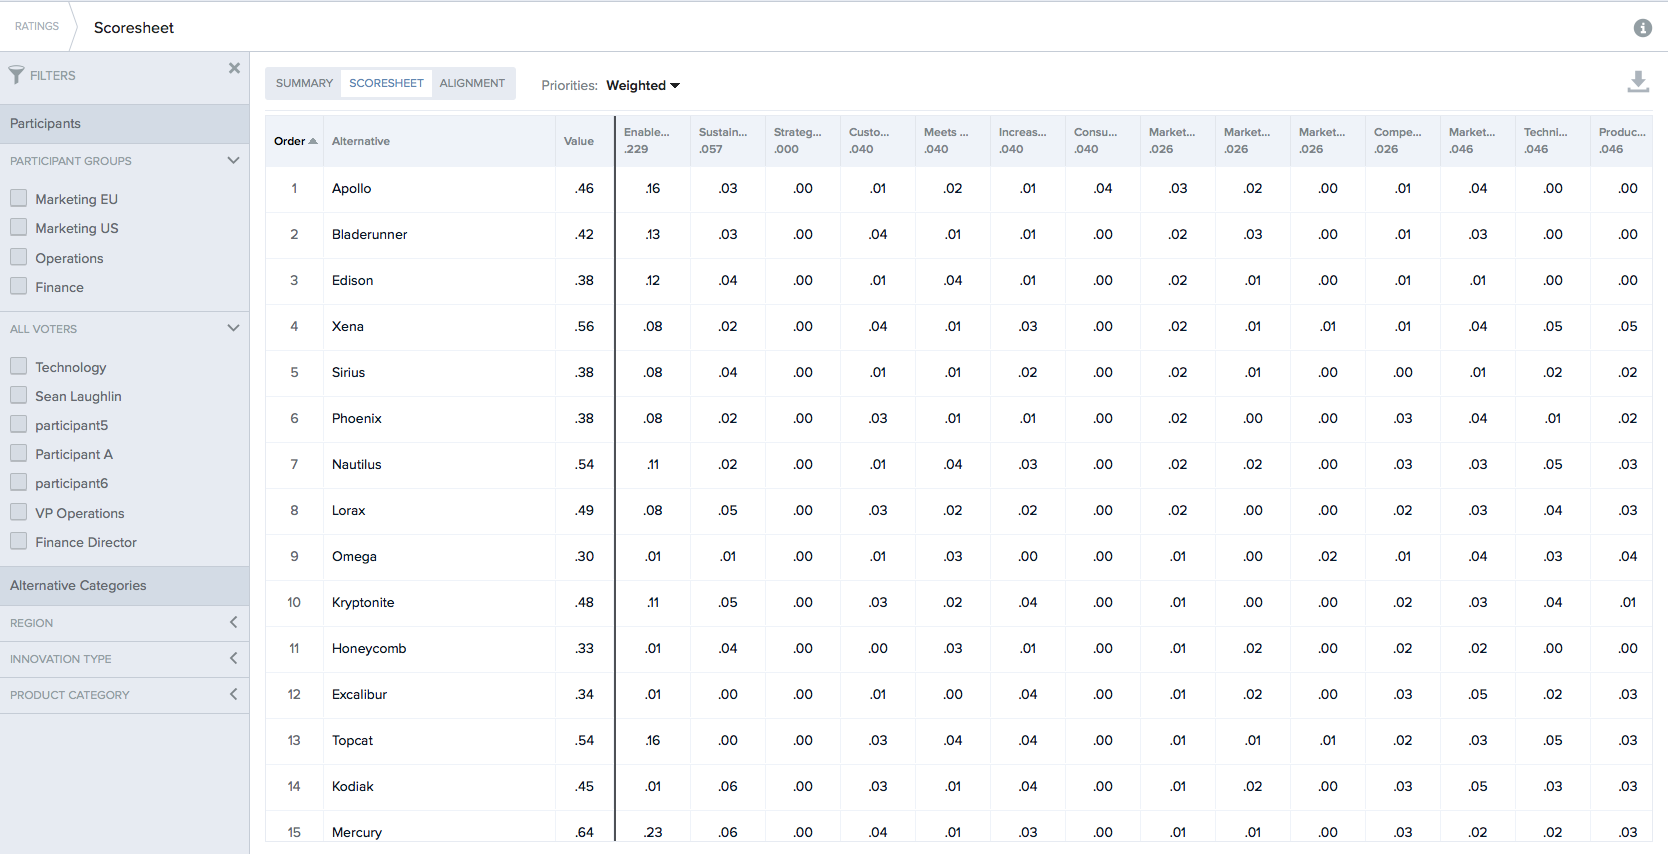
The Ratings Scoresheet displays the overall scores of the alternatives based on the averages of the participant votes entered in the Group Ratings process step. The summary ratings scores are shown to the right of the score in every cell. These are interpreted as strengths and weaknesses of the alternatives across the criteria structure.
Overall scores located in the Value column are derived by multiplying each rating times the weight of the criterion under which the alternative is rated, and then adding all of these products together to get a total score. To view the Rating inputs for a specific alternative / criterion click on the value and the system will jump to the section.
The Ratings Scoresheet can be viewed as Weighted or Unweighted.
-
Weighted Score: This is the weighted score for the rating, using the weight of the Criterion it was assessed against multiplied by the Group Average rating.
-
Unweighted Score: This is the raw group average score for the rating.
Ratings Scoresheet Features
-
Use the Control Panel to filter results by participant, group, or Alternative Category.
-
Export the Ratings Scoresheet by clicking on the Excel Icon on the top right of the screen.
-
Click in any cell of the matrix to jump to that Rating in the group screen.
-
Click on the quick links at the bottom of the page to go to Ratings or Graph the data set.
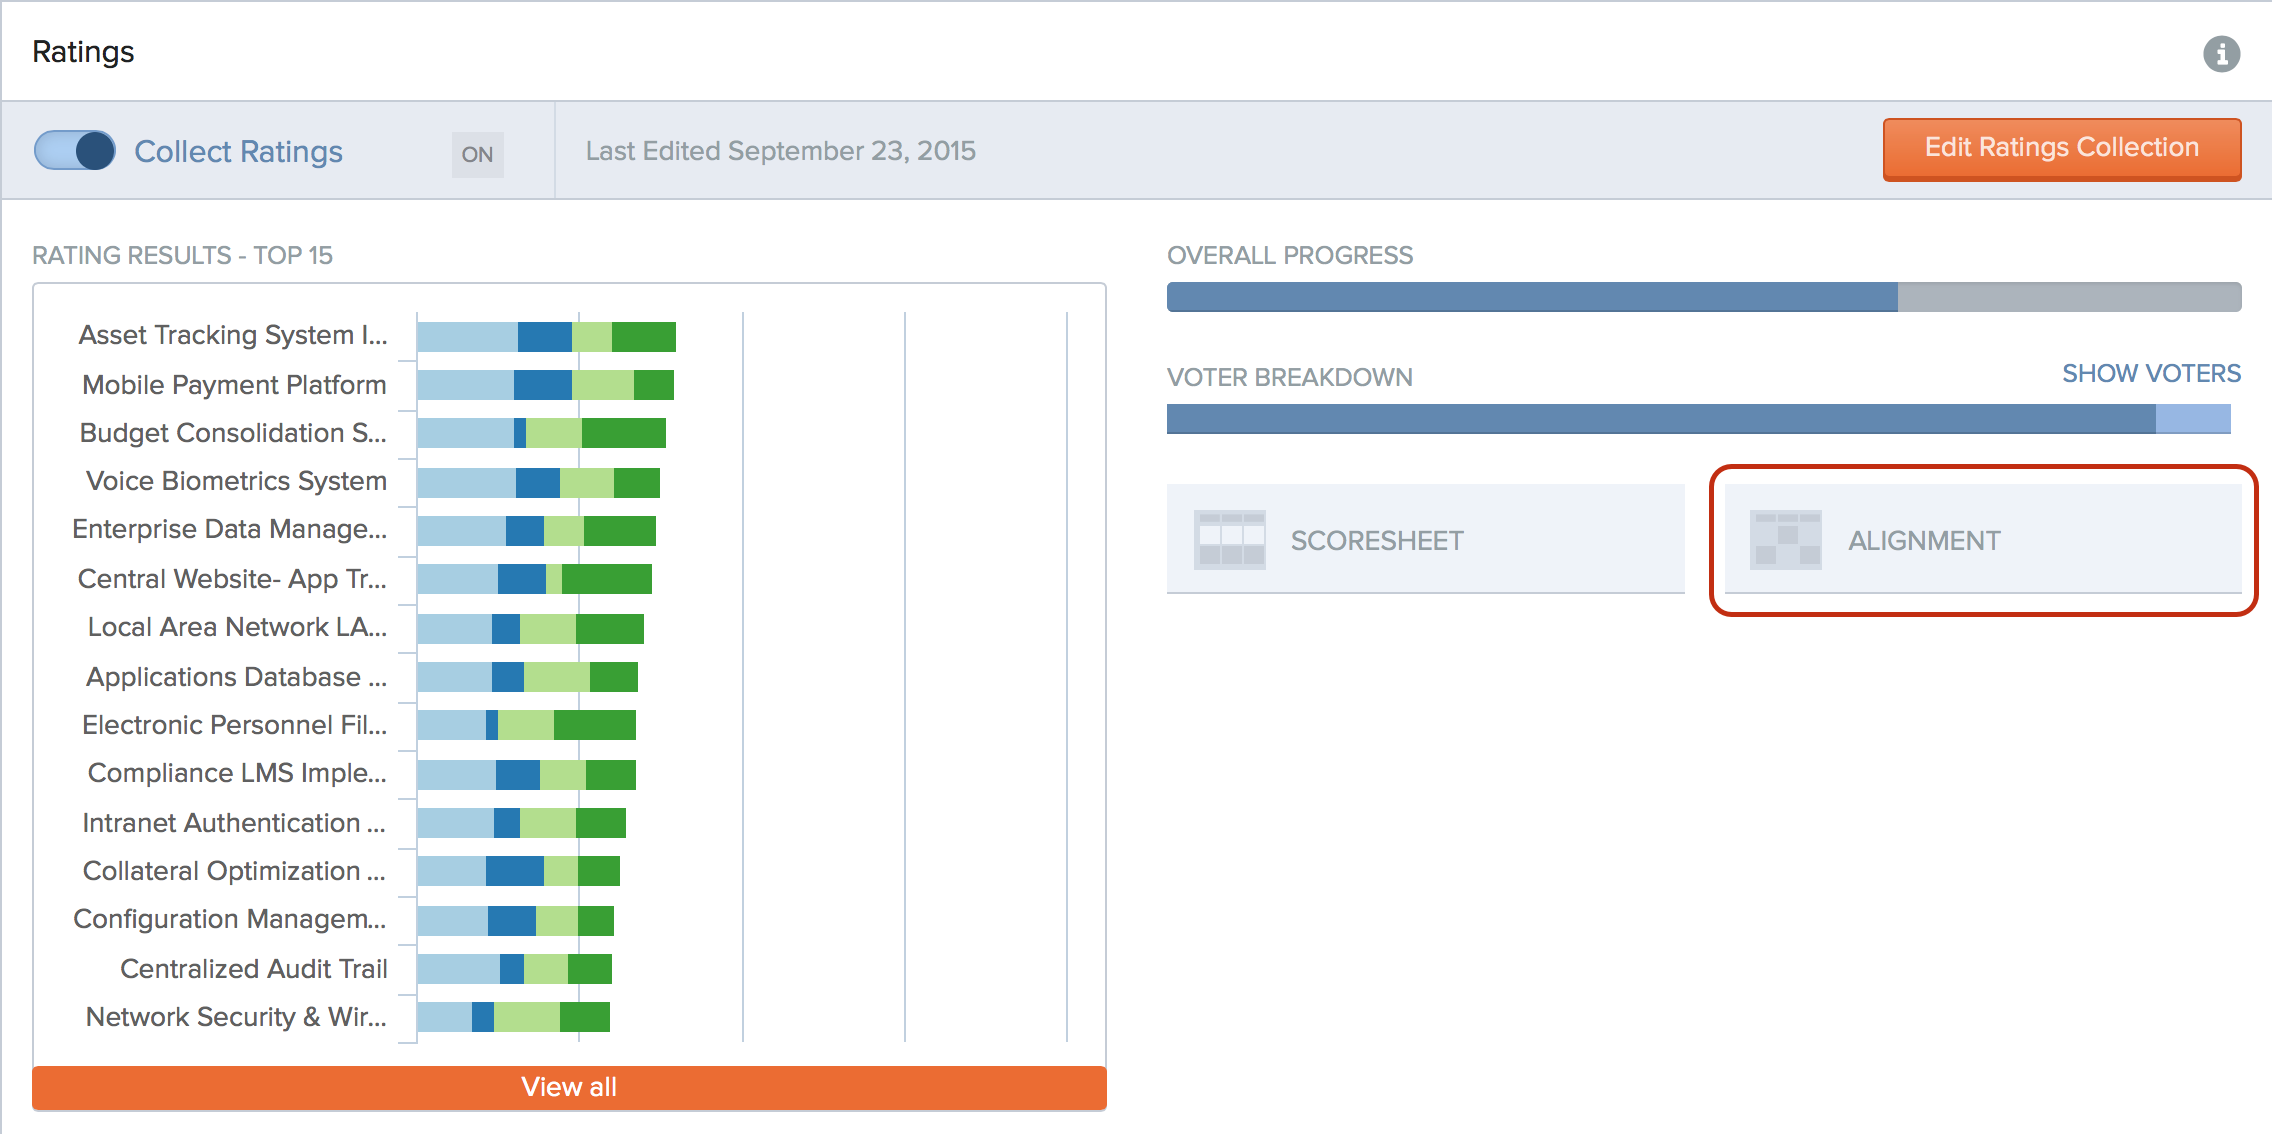
Alignment
The Alignment score represents the degree to which the participants’ ratings demonstrate agreement. If participants trend towards similar ratings, the alignment will be high; if there are differences between the participant ratings, the alignment will be low. Alignment Calculation takes into consideration the individual ratings as well as number of possible rating scales and number of participants.
The below ranges are used to determine if the Alignment is High, Medium, or Low.
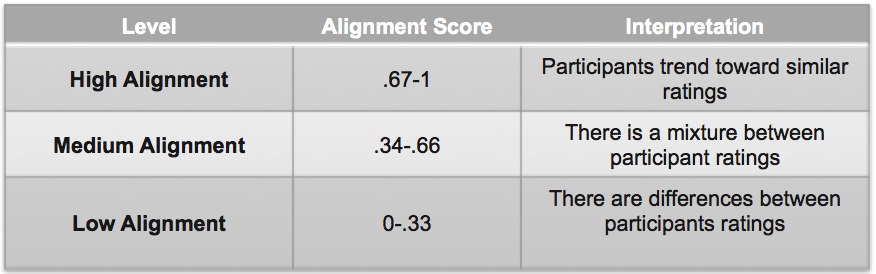
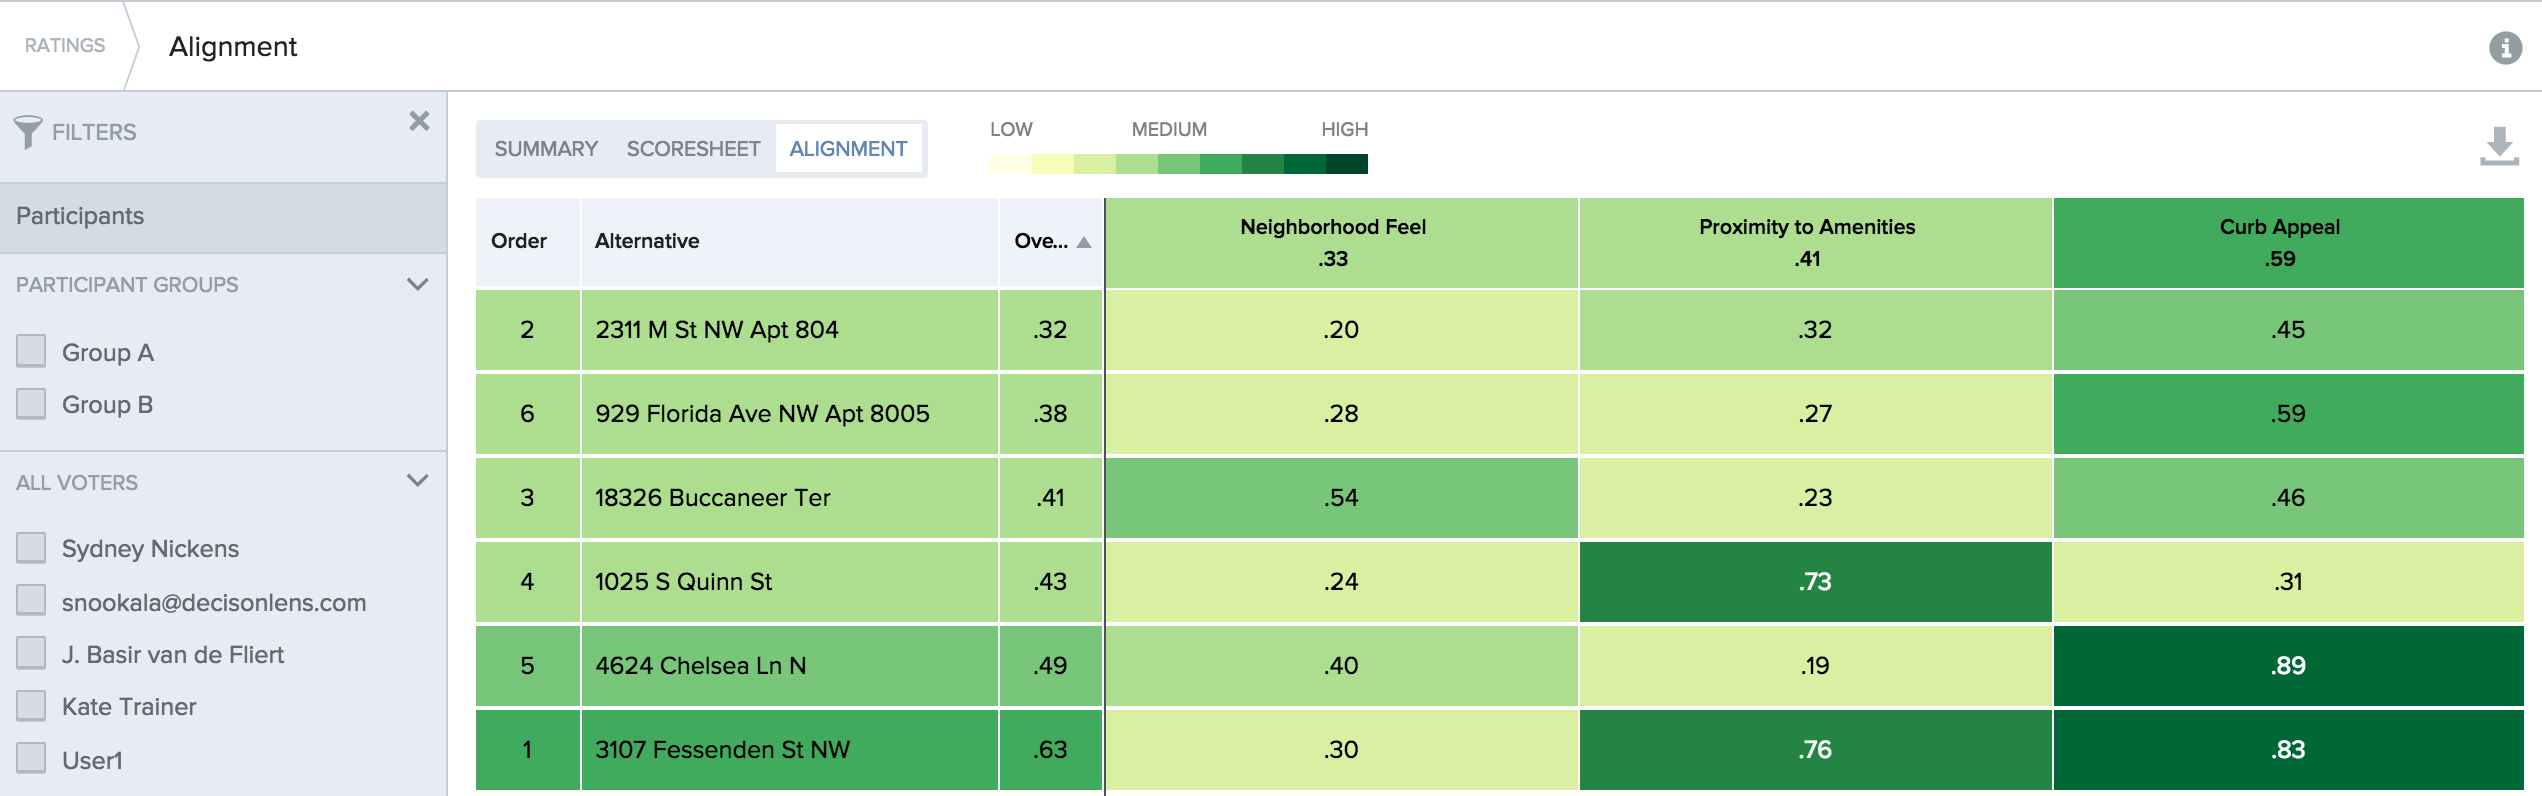
NOTE: Use the filter panel to select individuals or groups to include in the alignment visualization.