![DecisionLensLogo-standard.svg]](https://supporthub.decisionlens.com/hubfs/DecisionLensLogo-standard.svg)
The Criteria & Ratings Scales page is designed to help you develop scales for measuring against all of the lowest level criteria in the decision model. These rating scales will then be used in the collection step, Ratings, for the decision participants to rate the alternatives against criteria. Users can build unique scales for each lowest level criteria (scoring criteria) or scales can be intentionally generic and can be used across multiple criteria. Rating Scales can be created using Decision Blueprints® with Sample rating scales or by copying an existing rating scale from another criteria.
Verbal and Numeric Ratings Scales:
Rating Scales are designed to help users construct a measurement scale for each of the lowest level criteria show in the Criteria & Ratings Scales page. Rating Scales are used to evaluate the alternatives under that criterion. Rating Scales can be either verbal scales (qualitative) or numeric scales (quantitative). Using quantitative data, the decision makers are asked to interpret the data for value against the specific criteria. Unique scales can be built for each lowest level criteria (scoring criteria).
-
Verbal ratings scales are used to let decision makers to use words such as Excellent, Very Good, Good, Marginal, or Poor to rate alternative choices against each of the lowest level criteria in the scoresheet. Decision makers will assign weights to each of the words in the ratings scale with the highest rating receiving a score of 1.0. Each point in the scale can be defined to explicitly communicate what the ratings means in the context of the decision.
-
Numerical ratings scales are used with Metrics. Decision makers interpret numerical performance data by creating a prioritized scale with upper and lower bounds.
-
For example, if a decision-maker is buying a car, most people will not give much more value to a car that goes 250 MPH top speed than a car that goes 200 MPH. The numerical ratings mode enables you to assign a priority to numerical data so that it can be interpreted for its context in the decision. Decision Lens is set up to interpolate any data point that is entered between the data ranges you create. For example, if you create a data range for miles per hour (250, 200, 150, 100, 80), Decision Lens will know how to assign an intermediate priority to say 223 MPH. That intermediate priority is determined by connecting the priorities for 250 to 200 with a straight line then determining where on that line the 223 MPH falls with respect to priority.
NOTE: The ratings scales can also be intentionally generic and can then be used across multiple criteria. Ratings Scales typically have a high value of 1.0 and a low value of 0. The priority range between scale points can be different for each criterion.
Sometimes the scale values are expressed in different ways: .
-
Linear distribution - where there is an equal distance between each point on the scale. (e.g. 1.0, .75, .5, .25, 0)
-
Non-linear distribution - where there can be a variable distance between each point on the scale. (e.g. 1.0, .6, .25, .1, 0)
-
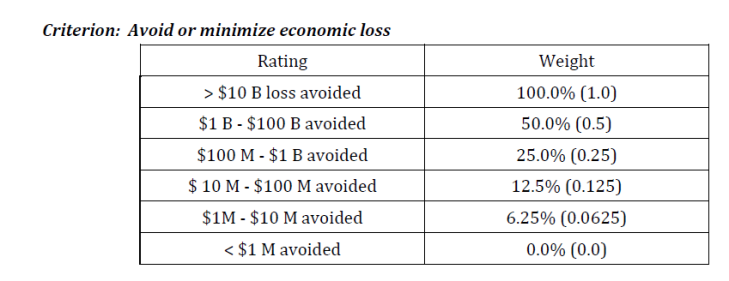
Ratio distribution - where the distance between each point is 50% less then the previous scale point (.e.g. 1.0, 5.0, .25, .125, 0)
Sample Ratings Scale