![DecisionLensLogo-standard.svg]](https://supporthub.decisionlens.com/hubfs/DecisionLensLogo-standard.svg)
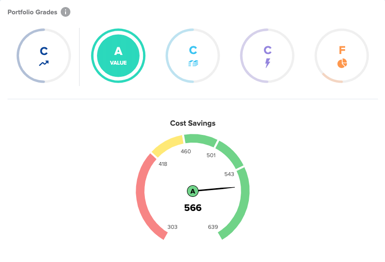
For all Value fields, the aggregation of data for allocated projects is displayed on a gauge visualization. The gauge is segmented to show the boundaries of each of the grades which are derived from the algorithm’s calculations based on possible Plans in the Portfolio Universe. In the example below, the Value grade for the Plan is an A as a Cost Savings of 566 falls within the highest (A) range. When there are multiple Value fields, the overall Value grade is the average across all fields with equal weighting.