![DecisionLensLogo-standard.svg]](https://supporthub.decisionlens.com/hubfs/DecisionLensLogo-standard.svg)
Schedule Page
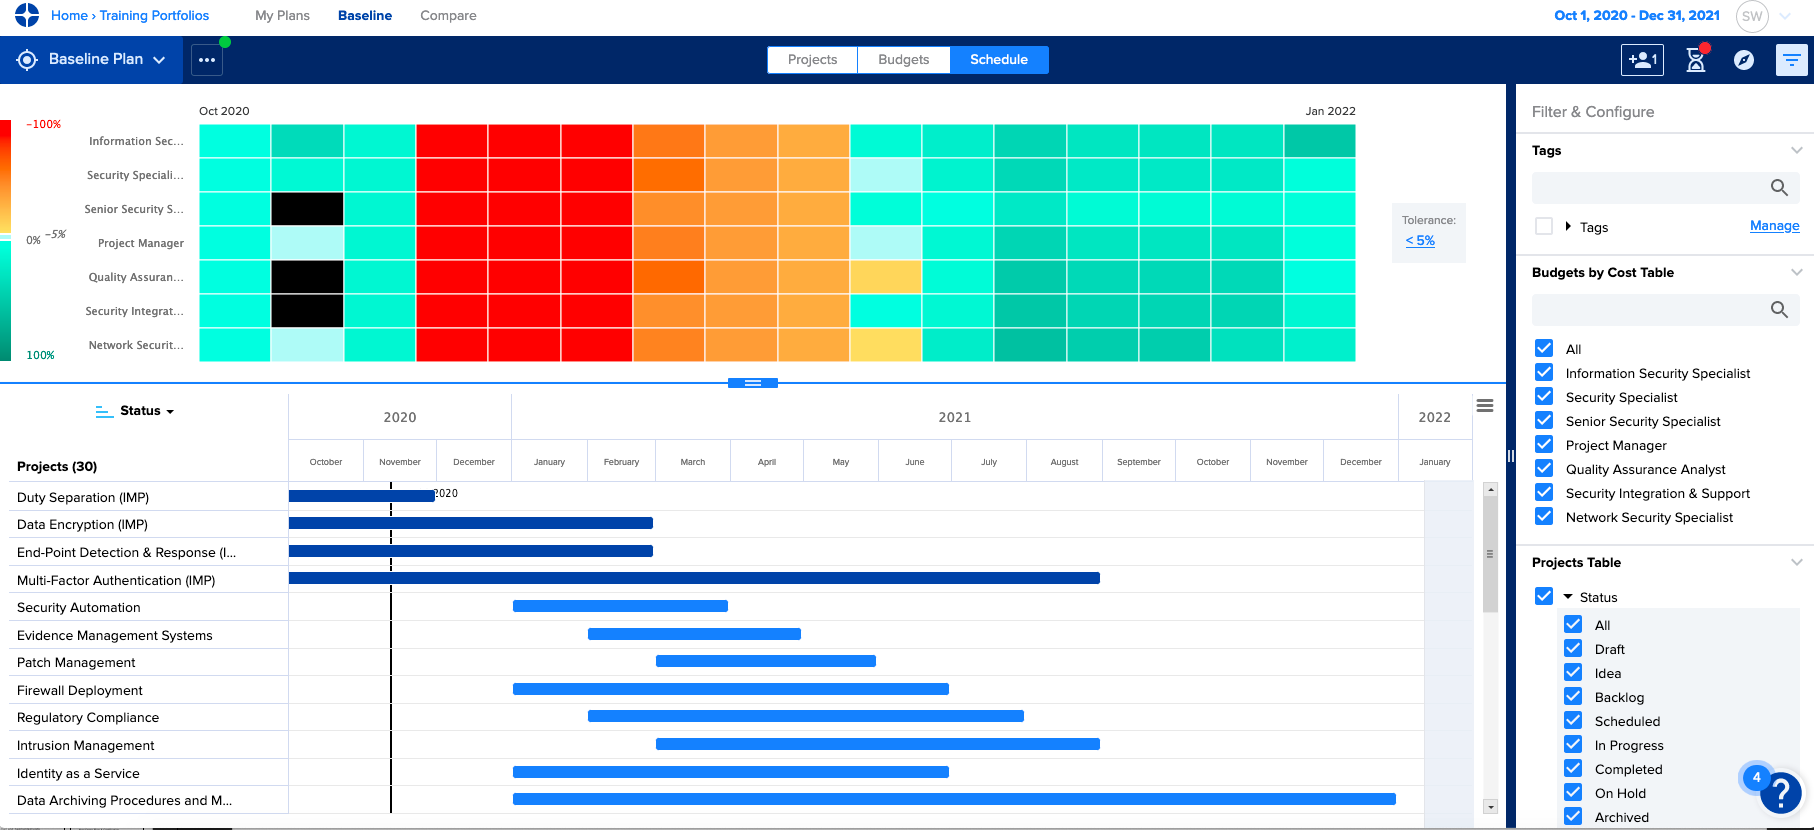
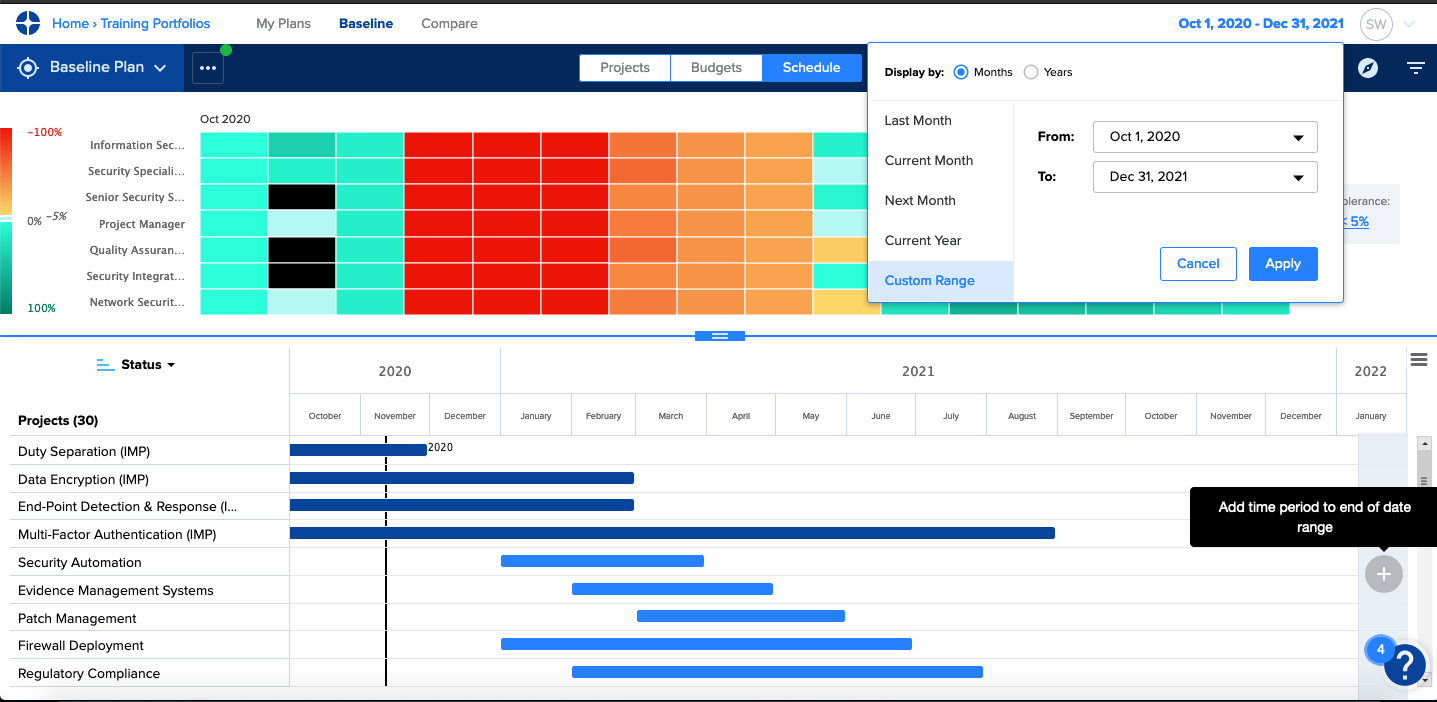
The Schedule Page gives planners a place to visualize and interact with their plans schedule. The schedule displayed includes all time periods within the date range identified in the top right.
- Heatmap identifies bottlenecks and enables tolerance to be adjusted
- Hovering over a cell provides Budget, Allocation within the month or year and the amount available for that month or year
- Gantt bars can be dragged to show impacts on budgets
- Gantt bars can be moved outside of the planning window or to the Backlog from the Gantt Chart
- Add additional months or years to your date range with the “+” button.
Sorting & FIltering in Schedule
- By default, only projects that are Scheduled or In Progress display in the Gantt Chart and projects are sorted by Status
- Projects can be sorted by:
- Name
- Status
- Start Date
- End Date
- Use the Filter & Configure panel to adjust the projects and budgets displayed within the Schedule Page
- Filter projects by any balance category or tag
- Additional filters:
- Projects with no costs: Select this to view projects that do not yet have any cost data
- Projects outside of date range: Select this to view projects in the Gantt Chart that start and end outside of the date range specified.
- Show locked projects: Use this to layer in projects that have been locked