![DecisionLensLogo-standard.svg]](https://supporthub.decisionlens.com/hubfs/DecisionLensLogo-standard.svg)
What is Cost Adjusted Value Score?
Cost Adjusted Value Score is a field available for Owners and Participants to display within the Score, Projects, Budgets, and Spend Plan Pages. This metric can help during prioritization to show the cost benefit relationship (Value Score/Total Cost). This metric is normalized on a scale from 0-1, where 1 is the most value for cost.
How is it Calculated?
Cost Adjusted Value Score is calculated by dividing the value score into cost for all projects. It is then normalized by dividing by the highest Cost Adjusted Value Score for all projects. Draft projects are not considered within this calculation.
The cost used in this equation, is either the Total Request or Total Allocation depending on the status of each project
- Projects in an Unfunded or Idea Status: Total Request is used, across all time periods
- Projects in a Funded Status: Total Allocation is used, across all time periods
Displaying Cost Adjusted Value Score
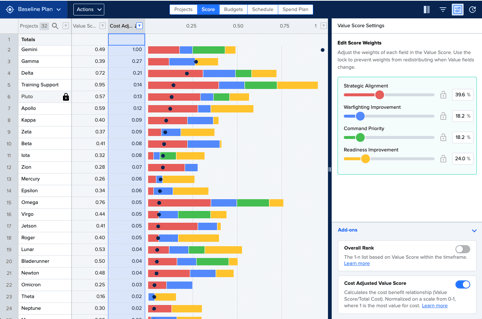
Cost Adjusted Value Score requires a portfolio to have Value Fields with scales and Project Requests and/or Allocations. This metric is off by default, but can be turned on by any Portfolio Owner from the Score Page in the 'Add-on's' section of the Value Score Settings Panel.
Once turned on, this metric can be viewed as a field by any Owner or Participant on the Score, Projects, Budgets, or Spend Plan Pages. Use Column Settings to add this field into your page.
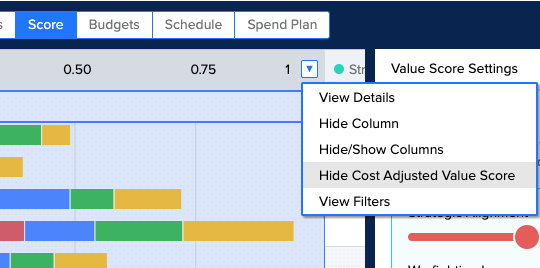
When enabled from the Score Page, Cost Adjusted Value Score will be added as a visualization on the Value Score Chart to see how each projects Value Score and Cost Adjusted Value Score differ. Turn this visualization on or off from the Value Score Charts column header dropdown.