![DecisionLensLogo-standard.svg]](https://supporthub.decisionlens.com/hubfs/DecisionLensLogo-standard.svg)
Overview
Decision Lens offers a variety of field types for Projects to help classify data. Fields can fall inside or outside of the Decision Lens VCRB Framework which helps with features such as Bottleneck Analysis, Strategy Navigator, and visualizations on the My Plans Page. Project Fields can be added manually or imported by Portfolio Owners.
Add or Edit Fields Manually
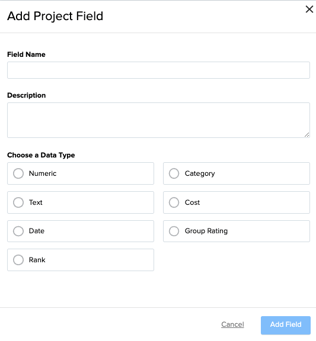
To add new fields: from the Projects Page, select the Actions menu and “Add Field”. Give your field a name and optional description and select the data type.
To update existing fields: from the Projects Page, select the dropdown arrow from a column heading and select Edit Field.
Decision Lens offers a variety of data types:
- Numeric: Field can only contain numeric data.
- Category: Category fields enable single selections from a group of options.
- Text: Field can contain any text or numeric data.
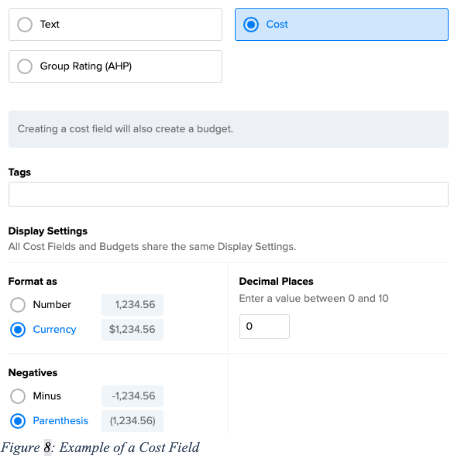
- Cost: Cost fields will automatically create a Budget field within the Portfolio.
- Date: Select from a variety of formats so that dates are all consistent within your field.
- Rank: Manually create a custom cascading rank without ties.
- Group Rating: This field type can be used to import data from your AHP exercise. The Analytic Hierarchy Process (AHP) is an in-depth collaborative decision-making methodology.
- Formula:
Create a formula field, based on one of the 5 operators: Add, Subtract, Multiply, Divide, or Days Between. Operators cannot be combined at this time.
Date Field Data Type
The Date data type enables you to add fields to capture dates outside of a projects start and end date. Decision Lens offers a variety of formats, and the ability to convert between formats.
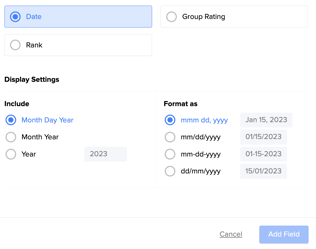
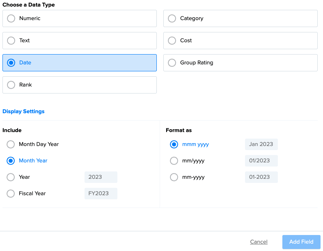
To add a date field, select the date data type and then select the level of granularity within the ‘Include’ section: Month Day Year, Month Year, Year or Fiscal Year. The Fiscal Year formatting option only displays for portfolios using Fiscal Years rather than Calendar Years.
Month Day Year and Month Year options have a variety of formats to choose from. Select a format and then select to Add Field. The format can be adjusted once the date field is added. Moving from a date that has less granularity to more granularity will automatically update the date to match the format.
For example: A field is formatted as Year. You convert the field to be formatted as Month Day Year. Any dates that had been entered for that column previously, will be updated to include ‘January 1’ within the date so that the formatting aligns with Month Day Year.
When adding a date for a project, double click within a cell to use the calendar to select a date. Depending on the granularity of the field, you will either select from a day within a month, a month, or a year.
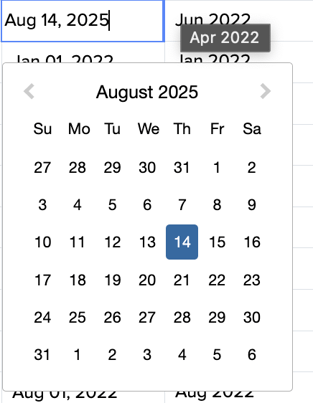
Dates can be copied and pasted and will automatically update to match the formatting selected for the field.
Existing Text or Category Text fields can be converted to a field formatted as Date. To do this, use the dropdown arrow from an existing field and select Edit Field. Select the Date data type and then select the format for the field. Data loss can occur if dates have not been entered in a format that Decision lens supports.
Use the column header of a date field to sort or filter. Dates are included within the export and can also be imported as part of the Projects and Fields data import. When importing dates, ensure the field in Excel has a Date or Custom format. If using the Custom format option, ensure the Type is set to an accepted Decision Lens date format.
Mapping to a Dimension
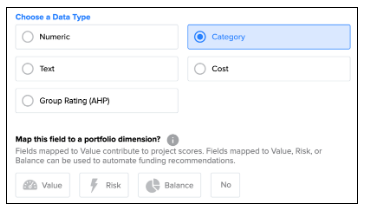
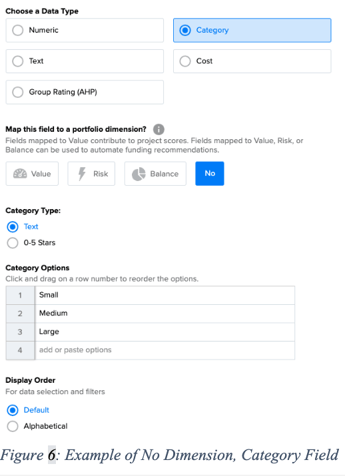
After selecting a Data Type, select if the field should be mapped to a dimension (if applicable). If it shouldn’t, select “No”.
Why map a field to a dimension?
- Map fields to Value to assist with Project Scoring and to use the Score Page. These fields have additional options to help establish the scoring framework for the field. These are things you want to do better on. Examples include Revenue, Mission Readiness, Net Present Value, Miles of roadway in good repair, et cetera.
- Map fields to Risk for further analysis in Strategy Navigator and to understand Risk composition on the My Plans page. These are fields where you want to know how certain you are that the project will do what it claims. Typically thinking in terms of the certainty of staying within budget and deadlines while bringing about the value it claimed it would.
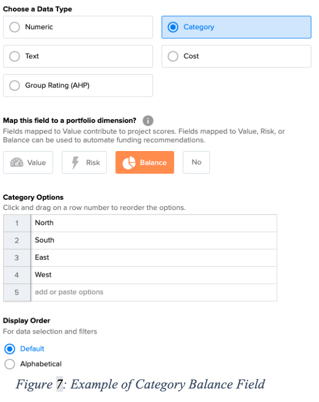
- Map fields to Balance for further analysis in Strategy Navigator and to understand funding of projects within a category to see if they are balanced. These are fields where you might want to see a breakdown by category to see if your plan is balanced across all options.
- Map fields to Cost if they are considered a resource for the portfolio. These are things that you are constrained on. You have a limited amount of resources, and each project uses those up, so you cannot possibly do everything. Examples are Pools of Money, HR.
- Select No if the field does should not be included in analysis for Scoring, Strategy Navigator or Bottleneck Analysis.
Once you select a dimension, follow the steps/options for the field you are creating and select Add or Update Field.
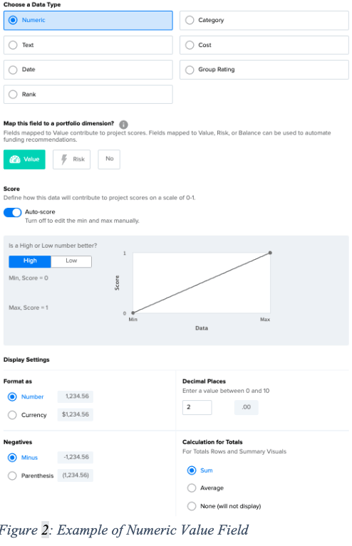
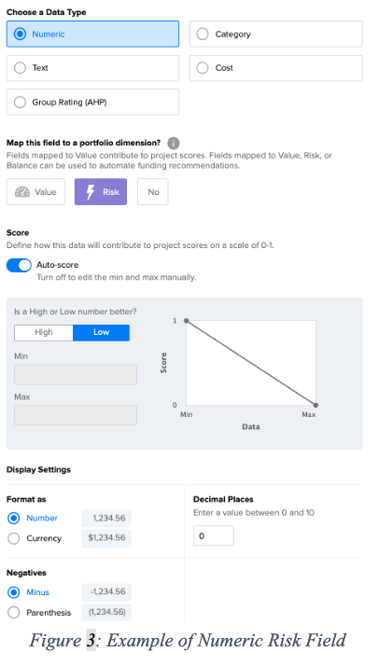
- Numeric Value or Risk Fields:
- Set minimum and maximum values to help determine what favorable or less favorable data points are for the field.
- Set if calculation totals should be displayed as a sum, average or should not display. This factors into visualizations on the My Plans page.
- Set the display settings. Settings include if data should display as a number or currency, the decimal precision, and how negative numbers should display.
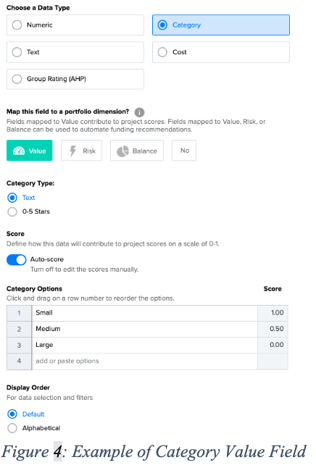
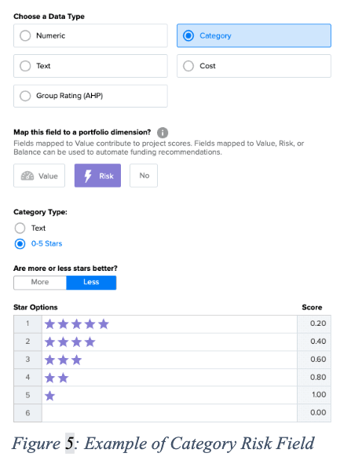
- Category Value or Risk Fields:
-
- Set Category Type as Text or 0-5 Stars. The text type enables you to customize options for selection. Up to 1,000 options can be added. Use 0-5 stars to select from a pre-populated list of 0-5 stars. This can be helpful for a quick way to score/assess a project.
- Category Balance or Other Fields:
-
- Customize the category options for the field. Options can be added manually or pasted in.
- Display Order: Set the order that the options will display in the dropdown. Default order is the order they display in the Add/Edit Field modal. Alphabetical order displays options from A-Z in the dropdown.
- Cost Fields:
-
- Set the display settings. Settings include if data should display as a number or currency, the decimal precision, and how negative numbers should display. Settings apply across all cost fields.
Watch our Data Management video below for more details!