
Gain a defensible, transparent 1-N list of priorities to ensure you are always ready to fund or resource the next most important priority.
Set Up the Scoring Framework
Scoring is a capability that can be used to help Portfolio Owners understand where projects fall in a 1-N list. This process helps with prioritizing projects within a Baseline Plan. Before projects can be scored, the Scoring Framework must be setup. To do this, identify or create fields of data that can be categorized as Value, or areas of improvement such as Revenue, Mission Readiness or Miles of Roadway in Good Repair. New Value Fields can be created from the ellipses menu (…) on most pages and existing fields can be mapped to Value by editing a field, or dragging a field into Value from the Mange Framework page.
There are 2 types of Value Fields that can be used for scoring: Numeric Value Field or Category Value Field.
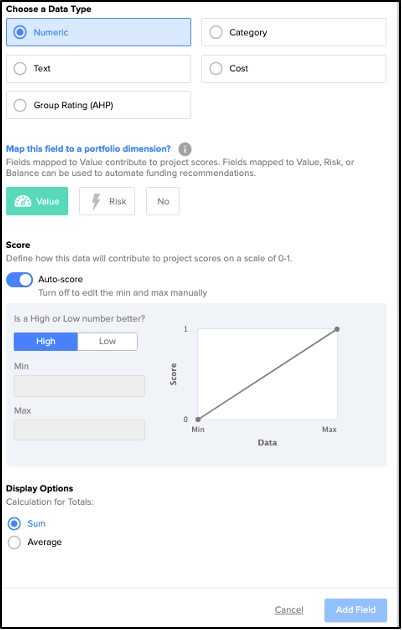
- Numeric Value Field: A field that uses numeric data to score projects.
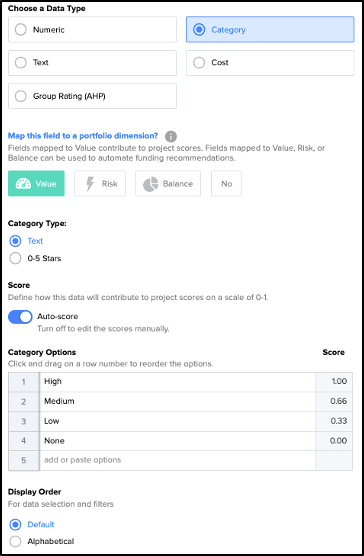
- Category Value Field: A field that uses text or 0-5 star options to score projects.
Once the Value Field type has been selected, adjust the settings for the field to finalize its framework.
Numeric Value Field Settings
- High or Low: Set if higher or lower numbers are better for the field.
- Auto-score or manual: Decide if the minimum and maximum values for the field should be determined automatically or will be manually set. These values inform what high or low scores would be for projects based on data entered for the field.
- Display Options: Set if totals should be viewed as a Sum or Average.
Category Value Field Settings
- Category Type: Select if category options will be text options or 0-5 stars. Text option allows you to enter up to 1,000 options to be selected from. 0-5 stars is a pre-populated list of options between 0 and 5 stars.
- Auto-score or manual: Set if scores will be determined automatically in a evenly distributed range between 0 and 1 or if custom scores will be entered for each category option.
- Display Order: Set if category options will display in the order they appear within the Edit Field modal or if they should display alphabetically. Options can be re-ordered within Edit Field by dragging and dropping.
Adjust Value Field Weights
Value Field weights can be determined in a meeting with leadership or manually entered in from a separate process.
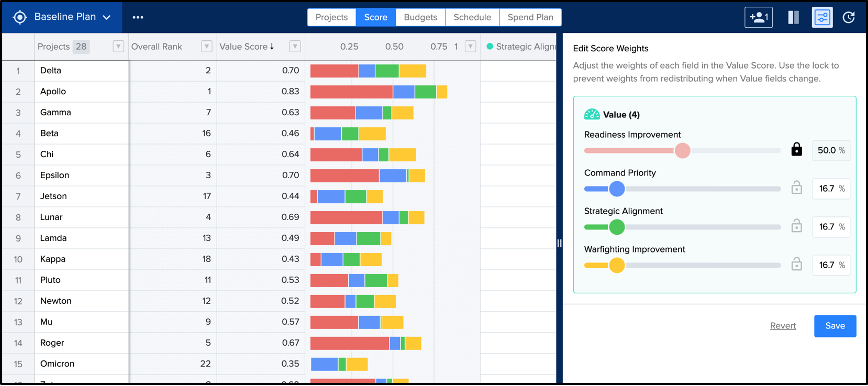
From the My Plans page, select the “Score” tab from the right hand navigation bar. Fields mapped to Value will display in the Weights Panel on the right side of the page. Use the slider for each Value Field or the text input to adjust each Value Fields weight. Once one field is adjusted, select the lock icon to lock it into place. All Value Fields must add up to 100% and will redistribute weight as adjustments are made.
Repeat this process until all Value Field weights have been modified and select Save. An activity item will be added each time Value Field Weights are saved to inform when they were changed and who made the update.
Collect Data
To begin scoring Projects, add or update Project data for the fields that have been mapped to Value.
- Use Intake Engine to send a form to people to collect Project data. Select “Request Ideas” from the ellipses menu in the blue navigation bar.
- Import Data. Portfolio Owners can import Project data.
- Manually add data from the Projects page. This can be done by anyone within the Portfolio that has edit rights to the Projects and Fields.
Review Results on Score Page
To start viewing your prioritized list, go to the Score Page. Portfolio Owners can access this and make changes to the Value Field weights.
The Score Page is sorted by Value Score to show which projects are your most valuable projects based off the weights entered in the Value Score Settings panel on the right. Adjust the Date Range in the top right to reflect the months or years you are prioritizing for.
Each Project’s Value Score is based off all fields that have been mapped to Value within a portfolio. The score is calculated by normalizing each data point across all value fields in a linear scale where the minimum data point receives a 0 and the maximum data point receives a 1.
Project Scores will display to two decimal places but are calculated rounded to three decimals. Hover over a score to see the entire score.
Open the Filter Panel to narrow down your list and focus on projects within a specific status or project category.
Use Column Settings to add in additional pieces of project data to better understand a projects score. Data can be edited directly from the Score Page or from within a project’s details view.
Project Scores and the 1-N list on the Score Page will automatically be updated as project data is modified.
Scoring in 60 Seconds
In Depth Scoring Walkthrough